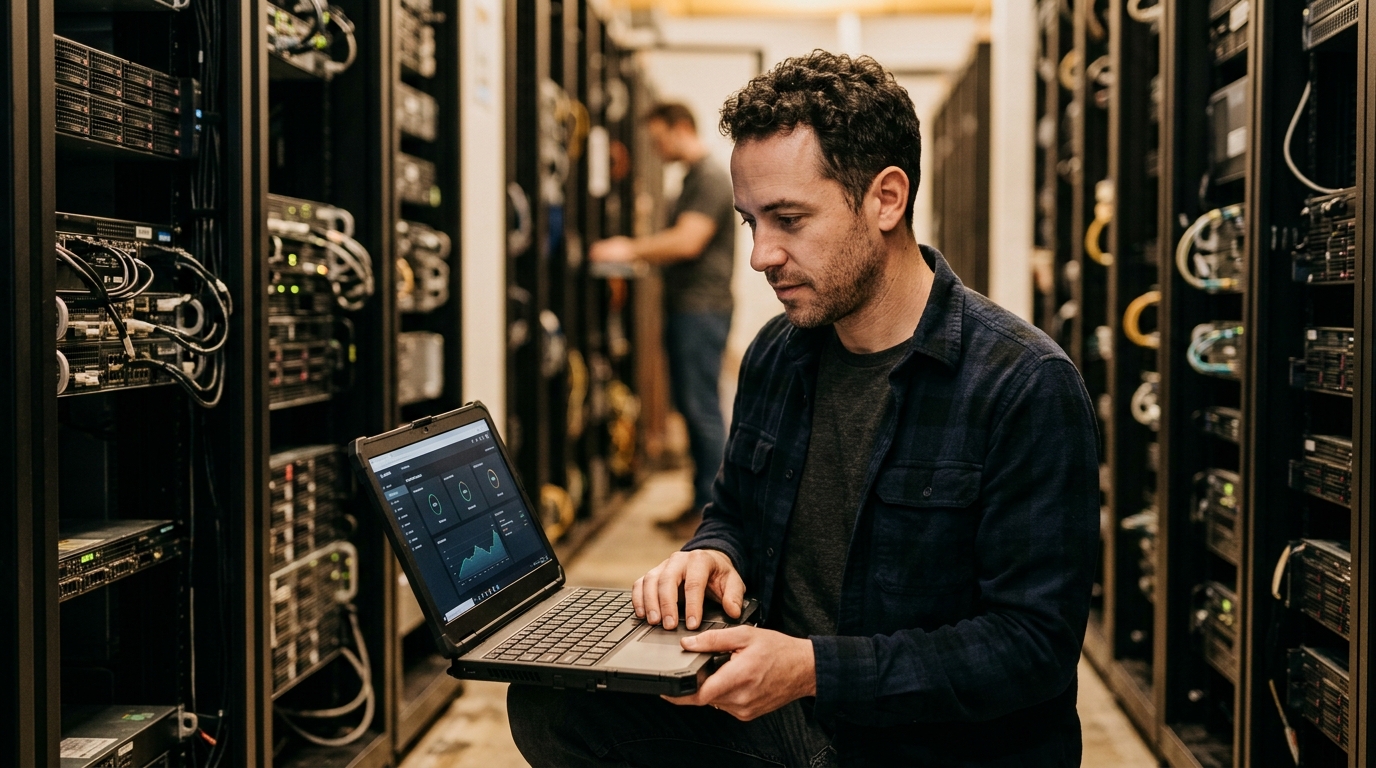
Real-Time Monitoring
CenterOS ingests telemetry from facility and IT gear alike — SNMP, Modbus, BACnet, MQTT, IPMI, NUT and native Prometheus — into a time-series datalake where every reading carries asset context.
Monitoring in Practice
Power, temperature and environment captured live from intelligent devices, charted per asset and per sensor, with alert history alongside.
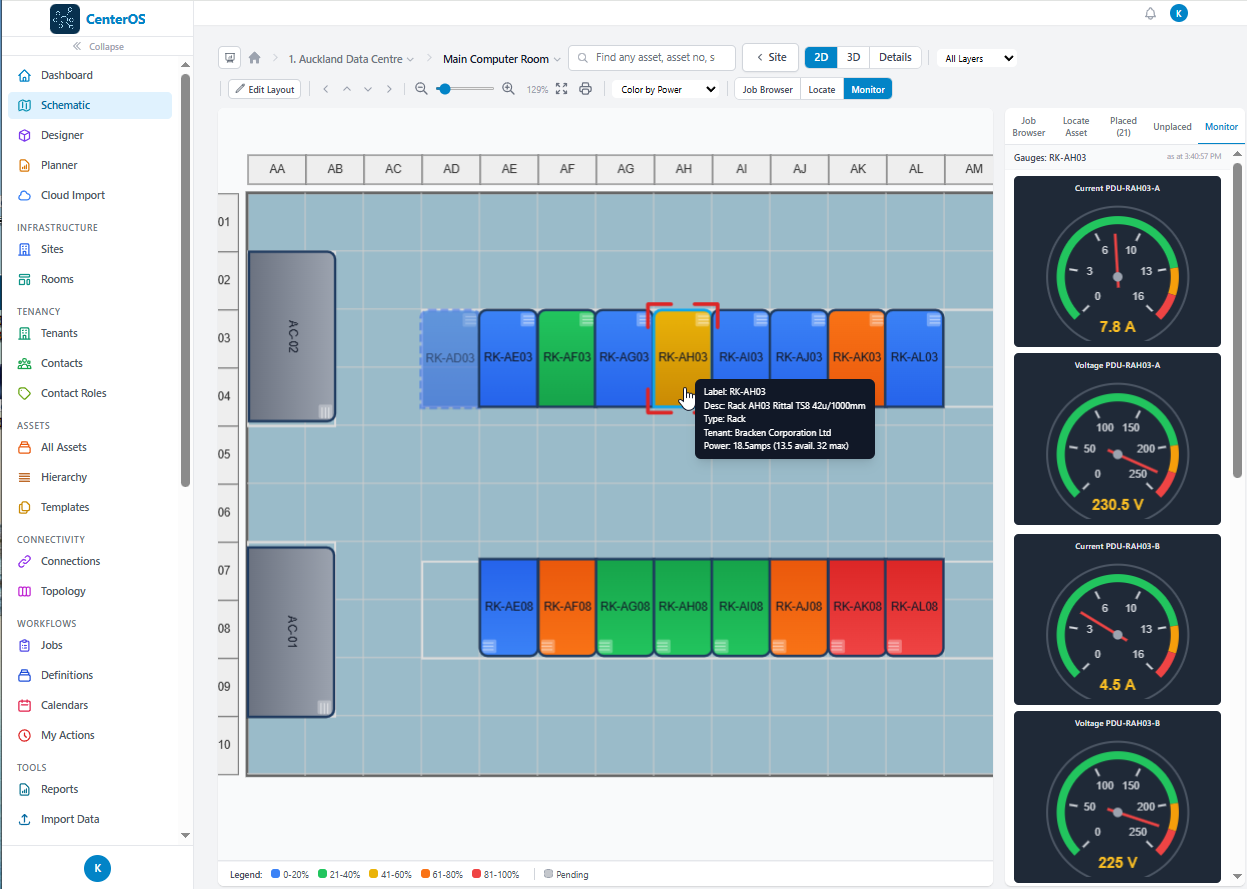
View monitoring for the Rack
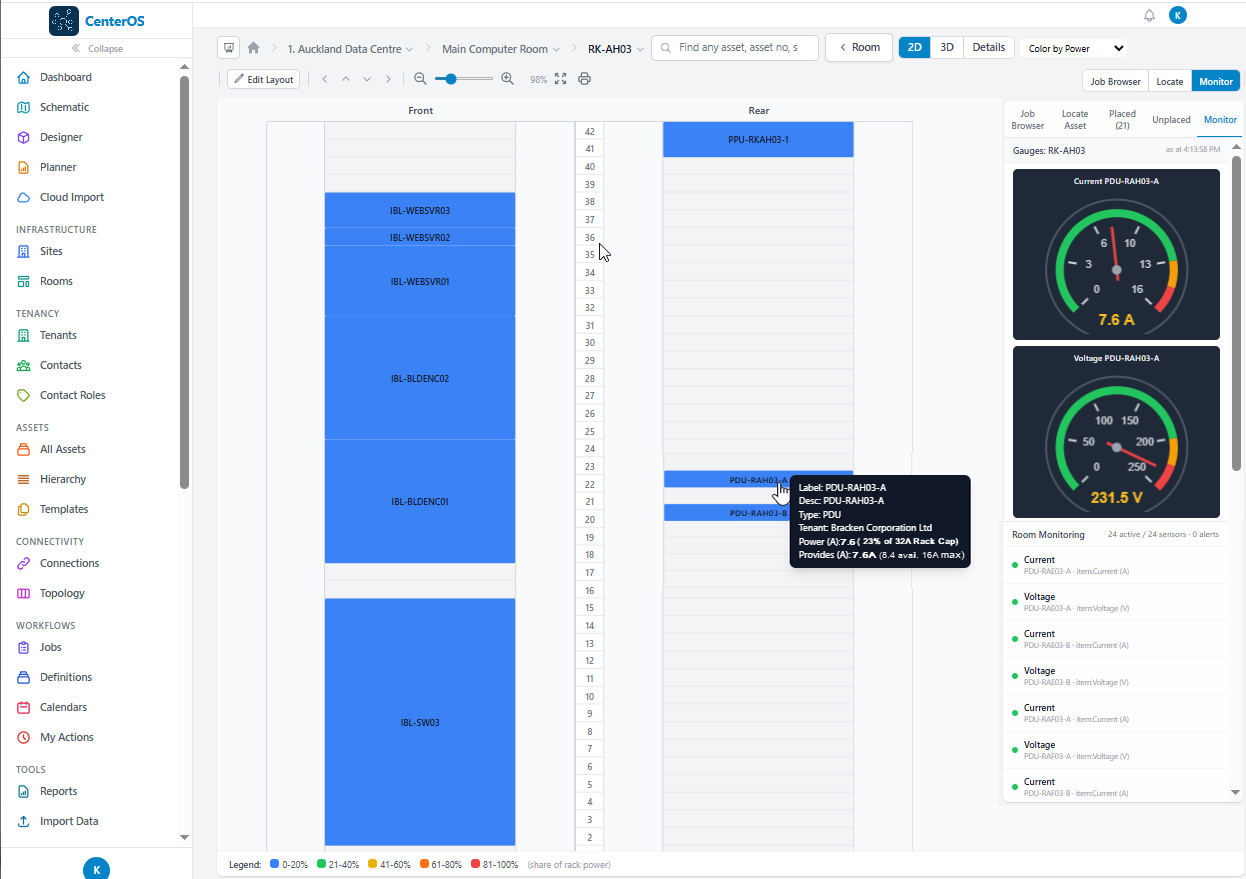
View Monitoring for the Asset in the Rack
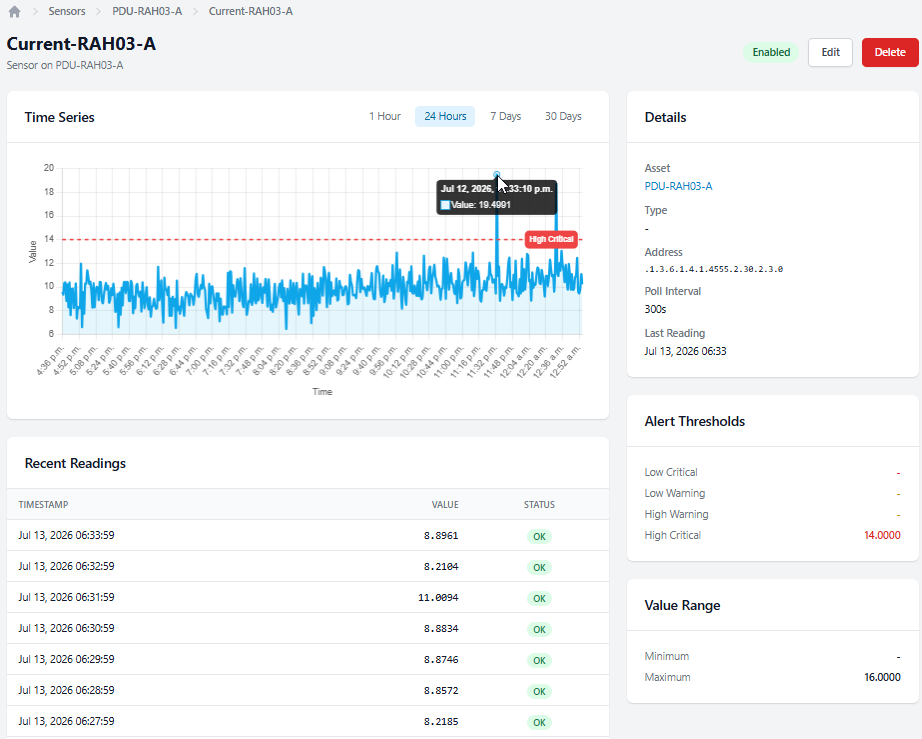
Graph monitored data over a period of time
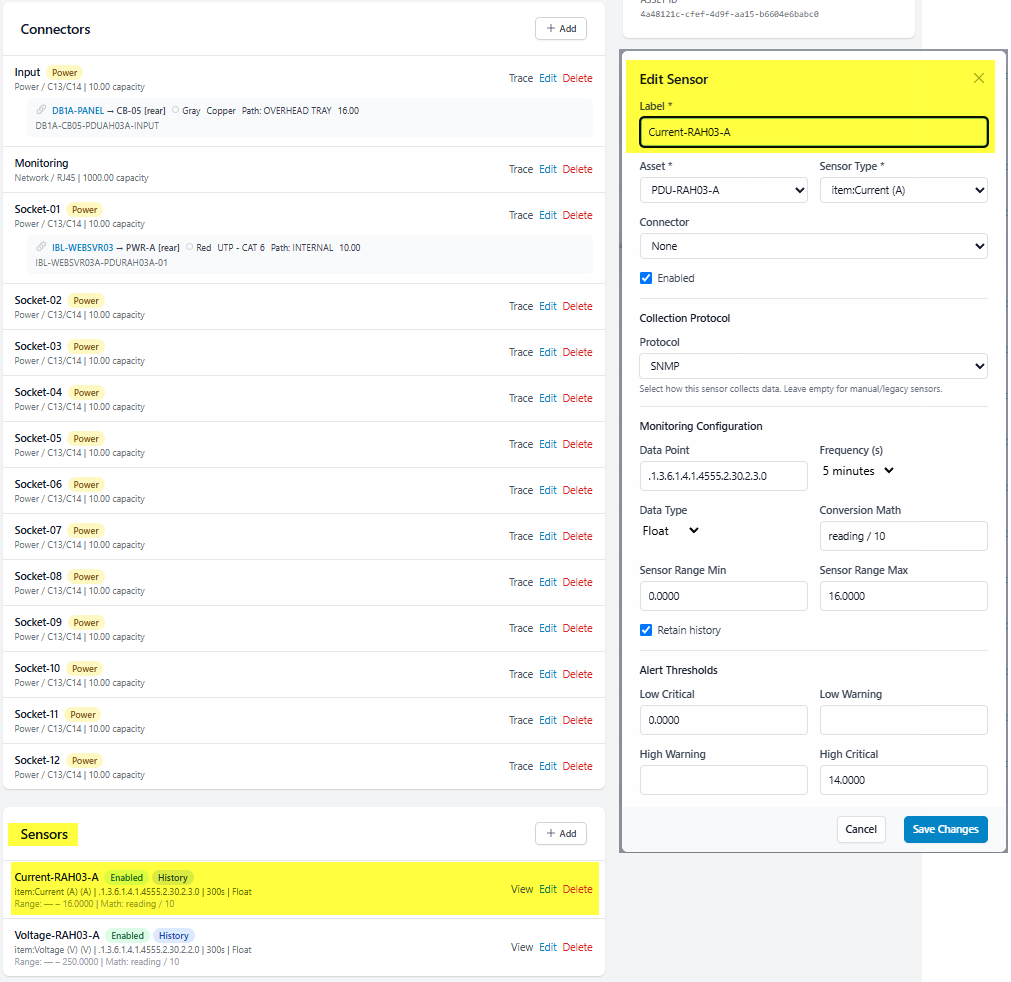
View sensors assigned to a device
One Collector Story for the Whole Estate
Facility gear and IT gear usually mean two monitoring stacks. CenterOS runs one: broad protocol support feeds a VictoriaMetrics-based datalake, two-tier alerting pairs low-latency PromQL rules with four-level application thresholds, and a threshold breach can open a warning or critical job with assignments and an SLA clock — alerts that do something.
- PDUs and power chains over SNMP and Modbus
- UPS systems, transfer switches and generators (including NUT)
- Chillers, CRAC/CRAH and in-row cooling over BACnet and Modbus
- Environmental sensors — temperature, humidity, leak detection, door contacts
- Servers via IPMI and native Prometheus scrape
- BMS integration plus cloud exporters (AWS CloudWatch, Azure Monitor, GCP)
- Grafana-friendly: datasource provisioning and dashboard templates — bring your own Grafana